Visualization
Buzzy visualization allows the communication of data in a visual manner, or turning raw data into insights that can be easily interpreted by your readers.
The charts available from the Visulaization component are based upon the Google Charts.
Example
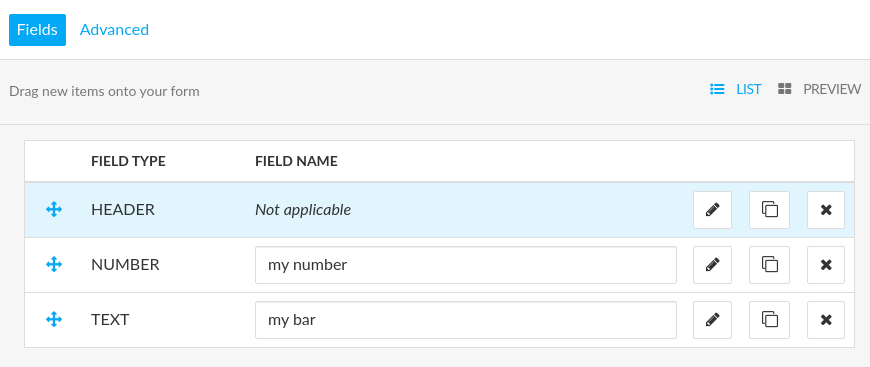
The data found in a Microapp is used in a visualization. For this example, we can create a Microapp with three fields: a Header, Number and Text:
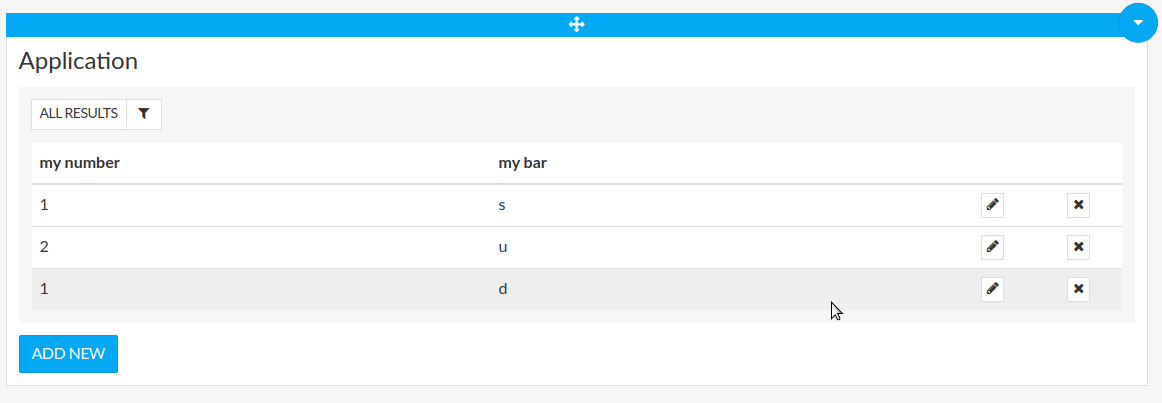
Enter some data:
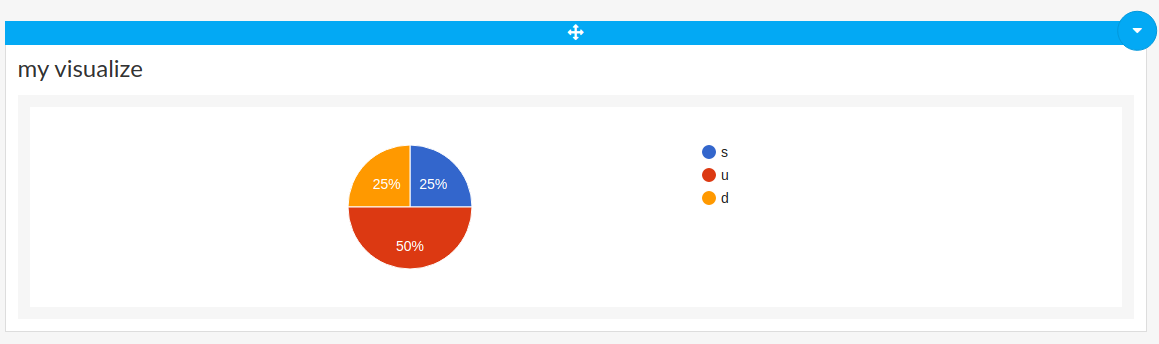
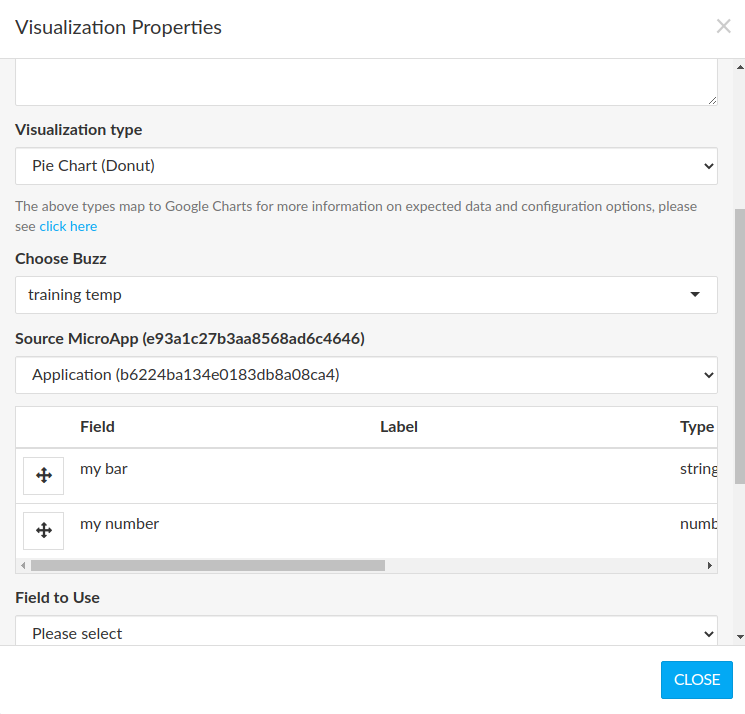
Next insert a Visualization component and configure it for a pie chart:
The output should look like this: